Check Your Site’s traffic for Google’s Mobile-Friendly update

Google began the roll-out of the mobile-friendly update on April 21, 2015. According to SearchEngineLand.com, as of May 1, the roll-out is complete, however the reindex has not been complete, so you may not see any significant impact on your site traffic for a few more weeks. The directions below will show you how to analyze your site traffic to determine if the mobile-friendly algorithm update has impacted you.
In order to analyze traffic, you must have a web analytics program installed on your site like Google Analytics, Adobe Site Catalyst, WebTrends, etc. The analytics program must have been installed prior to the algorithm roll-over. The following directions may be used for any tool, but the examples are from Google Analytics.
Follow these directions to determine if your overall site traffic has been affected:
- Go to the main view in your analytics tool, where you can see “sessions” or “visitors.” Example: In Google Analytics, choose Audience>Overview from the left hand menu.
- Select a date range that begins on April 21 and goes as far into the future as you can. Be sure that the last day is a full day. Example: In Google Analytics, from the calendar on the upper right, choose April 21 – May 3
- Now choose a comparison or baseline date range:
- Choose a comparison date range that is the same set of days in the past month, so if your first date range begins in the last week of April, your comparison date range should begin the last week of March.
- Both date ranges should begin on the same day of the week.
- Both date ranges should contain the same number of days.
- Example: In the calendar, click on the box next to “Compare to” and choose “Custom” in the drop down. For the comparison or baseline date range choose March 24 – April 5.
- Sidebar: When comparing date ranges, also be wary of holidays. Holidays will bring your traffic down.
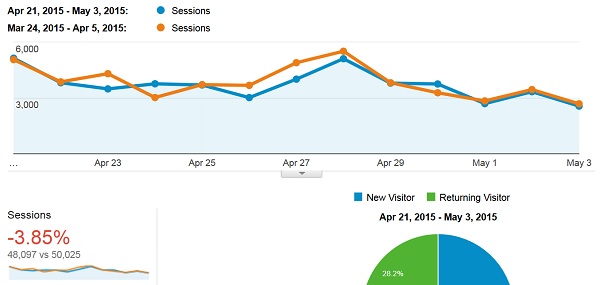
- Chart from the example (click on it to see it larger):

- It doesn’t appear as if there is that much difference in the example above. We need to look deeper.
Follow these directions to determine more specifically if your mobile traffic has been affected:
- Keep the same date range & comparison date range.
- Now choose only your mobile traffic.
- Example: In Google Analytics, still on Audience>Overview, click on “+ Add Segment” at the top of the page. Select Mobile Traffic, Deselect All Sessions, Apply.
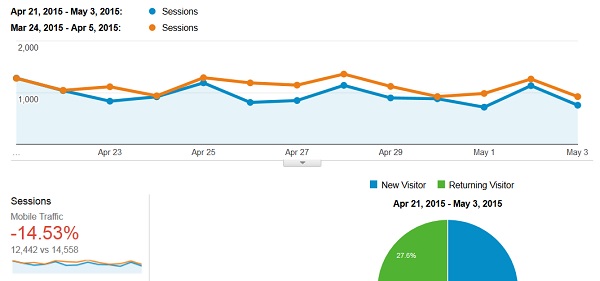
- Chart from example (click on it to see it larger):
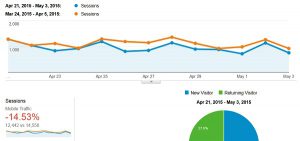
- In this example, it does appear that there is a difference. Using a statistical significance calculator (here is an easy one), it is, in fact, a statistically significant difference. We need to go one more step.
Follow these directions to determine if your organic traffic from Google has been affected:
- Keep the same date range & comparison date range.
- Look at only the Mobile Traffic coming from Google Organic.
- Example: In Google Analytics, still on the segment for Mobile Traffic only, go to Acquisition>All Traffic>Source/Medium. Select “google/organic.”
- Chart from example (click on it to see it larger):
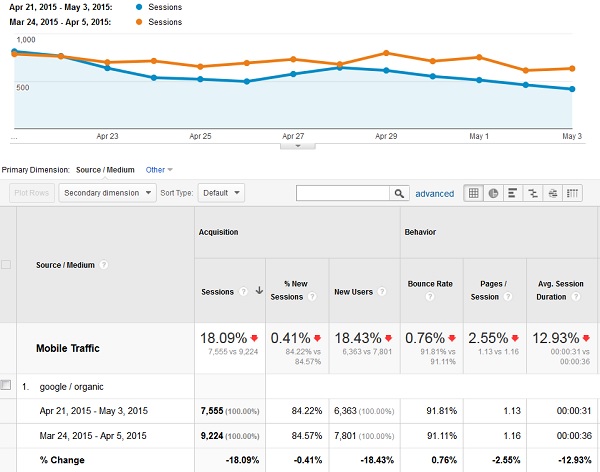
- The difference becomes larger when looking at Google traffic alone.
Final Analysis: This site has most likely been affected by Google’s Mobile-Friendly Update, this site will be redesigned and moved to the WordPress platform which uses mobile-friendly design.