2018 Q1 & Q2 Benchmarks for U.S. Healthcare Publishers & Advertisers
Benchmark metrics for consumer and professional healthcare publishers and advertisers.
Time range for this report: January 2016 – June 2018
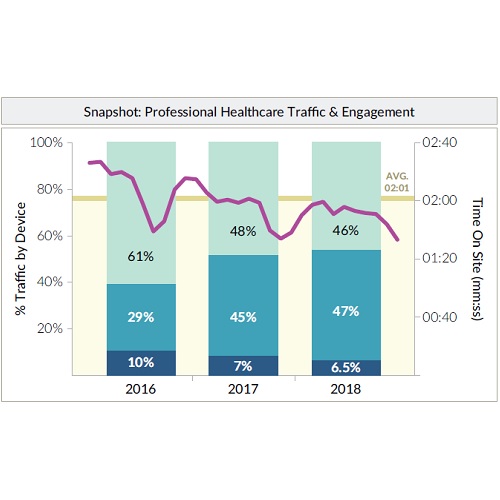
Notable Numbers for 2016-2018:
- 8% increase in mobile traffic across all audiences
- 12 second decrease in time on site for consumer audiences
- 16 second decrease in time on site for professional audiences
Metrics covered:
- Desktop, Mobile & Tablet Sessions
- Time on Site
- Pageviews per Session
- Bounce Rate
- In-View Rate (Viewability) on Display Advertising
- Non-Human Traffic Rate (NHT) on Display Advertising
- Click Through Rate (CTR) on Display Advertising
Don’t miss out on all of our free whitepapers.
Fill out this form to get your complimentary copy of 2018 Q1 & Q2 Benchmarks for U.S. Healthcare Publishers & Advertisers:
You will receive an email with a link to the PDF.