Website Metric Trends for Consumer and Professional Healthcare Publishers – 2015-2017
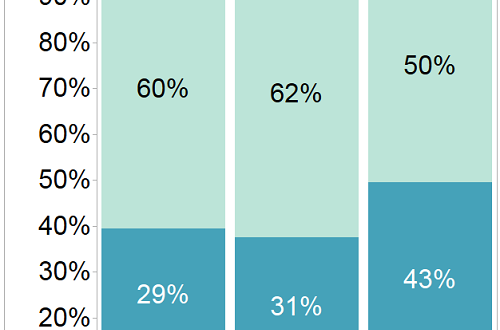
Benchmark metrics for consumer and professional healthcare publisher websites – the trends are clear:
1. Mobile is growing
2. Because mobile is growing, pageviews per session may decrease
3. The increase in mobile can also decrease time on site
Time range for this report: January 2015 – July 2017
The charts and graphs were created in Tableau by linking to Google Analytics via Google Spreadsheets. 21 web properties in the consumer and professional healthcare space were analyzed (the same properties were analyzed each year). The combined sites represent at least 70 million sessions per year.
Don’t miss out on all of our free whitepapers, including the latest Benchmark reports for U.S. Healthcare Publishers and Advertisers.
Fill out this form to get your complimentary copy of Website Metric Trends for Consumer and Professional Healthcare Publishers – 2015-2017:
You will receive an email with a link to the PDF.

